How to use a bubble chart to optimise your portfolio performance
… and see how to squeeze four dimensions into a two-dimensional chart.
From time to time you have to check your portfolio to find the underperforming assets and rebalance the allocation. Risk diversification and performance optimisation are the main aspects when rebalancing.
The conventional way
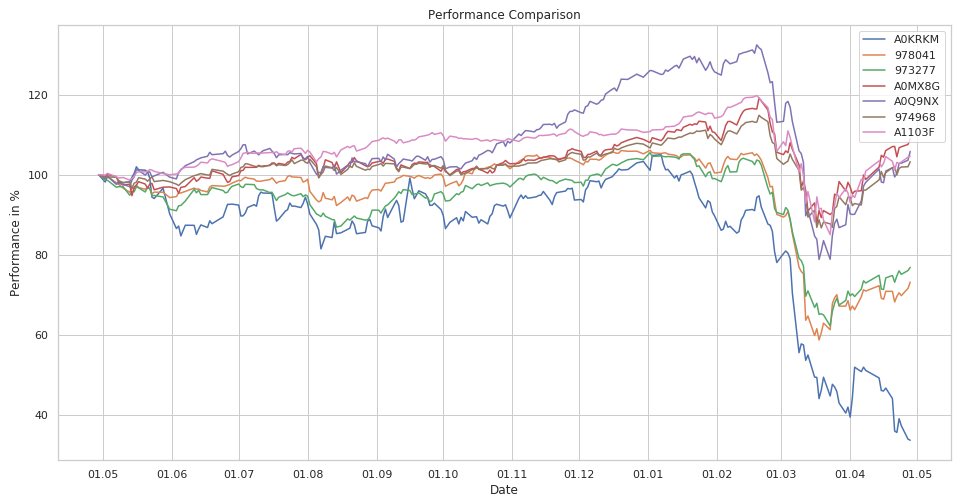
It’s time for rebalancing: How do your main assets perform? Which should be sold? Which position should be enlarged? Well, you might first create a conventional performance line chart. All lines aligned one year ago. There you see, which positions performed best over the last year.

But how did your assets perform over the last three years? And did they still perform in the last three months? But most important: how did your large positions do? What are your largest positions anyway? Where is your money allocated?
Even if you switch the timelines you still won’t see what your largest positions are.
The new visualisation
If you want to rebalance your assets you have to take all these criteria into account. Therefore I was looking for a visualisation that shows me all of the following in one view:
- 3 year performance
- 1 year performance
- 3 month performance
- position size
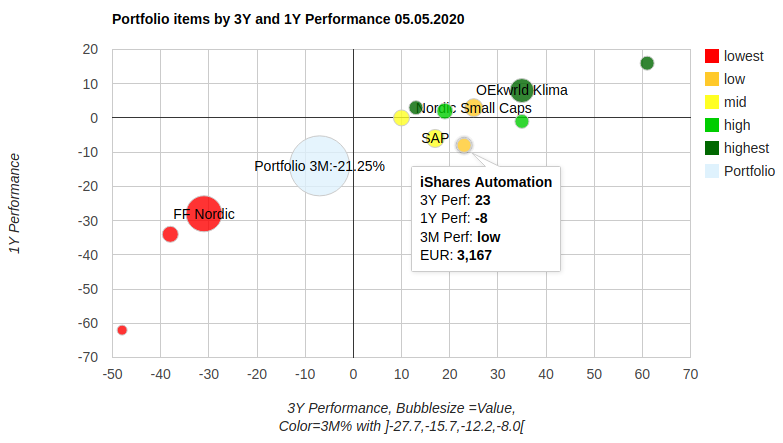
With a bubble chart I have found what I was looking for and so I did the following mapping:
- x-axis: 3 year performance
- y-axes: 1 year performance
- bubble colour: 3 month performance
- bubble size: position size.
And this is the result:

How to create the chart
The main components for creating this chart are: a comdirect ‘Musterdepot’ as data source, Google Charts bubble chart as visualisation and a python script as glue in between.
First I collected the portfolio positions in a comdirect Musterdepot (you have to register as member for free). Thereby it’s important to fill the values for ‘Stück’ to see the correct position size. After filling in the data you choose ‘Meine Übersicht’, click the ‘Konfigurieren’-button and add these columns:
- Wert in EUR
- WKN | Typ
- Perf. 3 Monate
- Perf. 1 Jahr
- Perf. 3 Jahre
After adding these columns you export the portfolio to a csv-file.
This file and an HTML-Template (see repo: portfolioPerformance_in.html) are the input for the python script. The script calculates the data array for the google visualisation, performance info and the tick labels. The 3-month-performance is reflected as the bubbles’ colours. The colours are five values corresponding to the performance’s quantiles.
With the parameter ‘absolute’ you can force the script to calculate absolute performance ranges instead of quantiles.
What does this chart show?
Each portfolio position is represented by a bubble. The size reflects the allocated money, x-position is the 3-year-performance, y-position is the 1-year-performance. The colour is read as follows: read the colour’s position from the legend (from red=lowest=1 to dark green=highest=5). Then take the position and find the corresponding interval in the description below the chart: e.g. light green position is the fourth value and the fourth interval ranges from -12.2 to -8 per cent. That’s the performance value for the last month for the light green bubbles. Not much, but we are now right after the corona shock. Next year the intervals should be filled with higher values.
You find details for each position when hovering above the bubbles.
And what does the chart tell us?
First thing you should notice: this portfolio has way too much money located in the low performing Fidelity Funds Nordic (FF Nordic). -30% in 3 years, -28% in the last year and less than -27.7 percent in the last three months.
There are two other positions luckily not as large as the former but performing even worse with no hope in the last three months. Though this portfolio has many well doing positions its overall performance is dragged down by the three formerly mentioned.
Do the rebalancing
The rebalancing goal should be to have as many assets as possible in the upper right quadrant and as few as possible in the lower left. Therefore the lower left assets are the candidates for selling while the upper right positions are the candidates for expanding.
But as always before switching positions, ask yourself these questions:
- Do you see any chance that the performance of the upper right positions will still be good in the future?
- Will the lower assets be liquidated completely or should there remain some fragments? Do you see chances they will do better in the near future?
- Is the target portfolio still sufficiently diversified or will there be a concentration of risk (maybe in Tec stocks)?
- What are other good performing assets with low correlation (see my correlation articles) that suit my portfolio?
And if you’re curious about the dark green star in the upper right corner check out the code, build the chart and hover.
Example
See the interactive example here.

